How Britain's mapmakers track climate change / Photo: Brook MITCHELL - AFP
Once used to defend Britain's shores against Napoleonic France, the Ordnance Survey's detailed maps are now essential for tracking and adapting to climate change.
"I would argue there is no clearer way to see the impact of climate change than looking at a traditional map," Tom Gray, a utilities and transport expert for Britain's national mapping agency, told AFP.
He was sitting in front of an aerial photograph of dry land projected onto a big screen at the OS headquarters in the port city of Southampton, southern England.
Here, hundreds of people work to collect location data and maintain the National Geographic Database, which includes more than 600 million features, monitoring "almost anything you can think of" and updated 30,000 times a day, Gray said.
The OS first started mapping Britain 230 years ago and has since documented the changes in the country's topography.
"There's a noticeable change in habitats, mainly because of human intervention ... but also the direct impacts of climate change, especially around waterways," said Gray.
On the screen behind him, he cycled through OS maps of the country, highlighting where climate-related subsidence is likely to happen, which homes bordering rural areas are at the highest risk of wildfire, and which parts of the country face flooding -- the biggest climate threat to Britain, according to him.
"Twelve percent of all of the UK's strategic road network is in the highest risk zone for flooding, and 20 percent of the rail network is," Gray said.
"When an emergency service worker needs to attend a flood, they can use our data to determine exactly where the hotspots are for flooding, where it's most likely to happen, and how they can access that property," he explained.
- Climate emergencies -
Many services rely on OS data to react to climate emergencies.
"There was some coastal erosion across on the Isle of Wight (off the coast of southern England) that needed to be updated quickly," Helen Jones recalled.
She is one of 21 drone pilots for the OS, in charge of collecting footage to track changes on the ground.
"We flew the site with the drone to update the mapping, which allowed other agencies like emergency services and councils to look at that particular area and predict where they might have to cut off gas and water, and potentially evacuate people."
She talked to AFP from Winchester, near Southampton, where she was filming a new housing development.
"If that rural land has any issues in terms of fires or flooding, if the estate isn't mapped, (emergency services) won't know that people will be in trouble or that there needs to be a certain response," she said.
The footage she was collecting will be sent to the OS's headquarters, where specialists add it to maps, capturing all the changes on the ground within one centimetre (0.4 inches) and including everything from buildings to bins and lampposts.
The process of turning her drone footage into maps is so detailed that a single block can take several hours, said specialist Sean Kennedy, armed with 3D glasses to better identify objects.
Such detail is important so authorities can see where access points to the housing estate are, useful when planning for climate emergencies such as wildfires.
"It's quite good when we come out on site because people come and ask what you're doing and we're able to explain that actually, because the emergency services use our data, it's really important that we get their house on the map," Jones said.
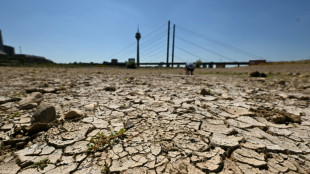
She has been a surveyor for seven years and said she is seeing the impact of this year's drought, as England and Wales experienced their driest July on record, according to the Met Office weather agency.
"I think everyone's going to have to start taking (climate change) seriously," Jones added.
"I've not had a summer where we haven't had any kind of rain. And we can't fly in rain so it's been good in terms of drone footage, but it's not good for anything else."
T.Jamil--DT